

EXPAND ALL
- Home
- About Pixie
- Installing Pixie
- Using Pixie
- Tutorials
- Reference

This tutorial will demonstrate how to use the OpenTelemetry plugin for Pixie.
To export Pixie data in the OpenTelemetry (OTel) format, we will:
Note that Pixie's API can also be used to run the PxL scripts developed in Step 2, however this tutorial will cover the Plugin System only.
You will need a Kubernetes cluster. If you don’t already have one, you can create a minikube cluster following the directions here.
You will need to install Pixie on your cluster using one of our install guides.
If you don't already have an OTel collector set up, you can follow the directions to deploy our demo collector here.
Most OTel collectors are configured to forward metrics to other tools such as Prometheus or Jaeger. For the sake of this tutorial, our demo collector simply outputs the metrics it receives to its logs.
PxL scripts are used to query telemetry data collected by the Pixie Platform. Our PxL script will also export the Pixie data in the OTel format. We'll use the Live UI's Scratch Pad to develop our PxL script.
Open Pixie's Live UI.
Select the Scratch Pad script from the script drop-down menu in the top left.
Open the script editor using the keyboard shortcut: ctrl+e (Windows, Linux) or cmd+e (Mac).
Replace the contents of the PxL Script tab with the following. Hover over the code block below to show the copy button in the top-right.
1import px2# Read in the http_events table3df = px.DataFrame(table='http_events', start_time='-10s', end_time=px.now())45# Attach the pod and service metadata6df.pod = df.ctx['pod']7df.service = df.ctx['service']8# Count the number of requests per pod and service9df = df.groupby(['pod', 'service', 'req_path']).agg(10 throughput=('latency', px.count),11 time_=('time_', px.max),12)1314# Change the denominator if you change start_time above.15df.requests_per_s = df.throughput / 101617px.export(df, px.otel.Data(18 # endpoint arg not required if run in a plugin that provides the endpoint19 endpoint=px.otel.Endpoint(20 url='otel-collector.default.svc.cluster.local:4317',21 insecure=True22 ),23 resource={24 # service.name is required by OpenTelemetry.25 'service.name' : df.service,26 'service.instance.id': df.pod,27 'k8s.pod.name': df.pod,28 },29 data=[30 px.otel.metric.Gauge(31 name='http.throughput',32 description='The number of messages sent per second',33 value=df.requests_per_s,34 attributes={35 'req_path': df.req_path,36 }37 )38 ]39))4041px.display(df)
Run the script using the RUN button in the top right or by using the keyboard shortcut: ctrl+enter (Windows, Linux) or cmd+enter (Mac).
Hide the script editor using ctrl+e (Windows, Linux) or cmd+e (Mac).
Your Live UI should output something similar to the following:
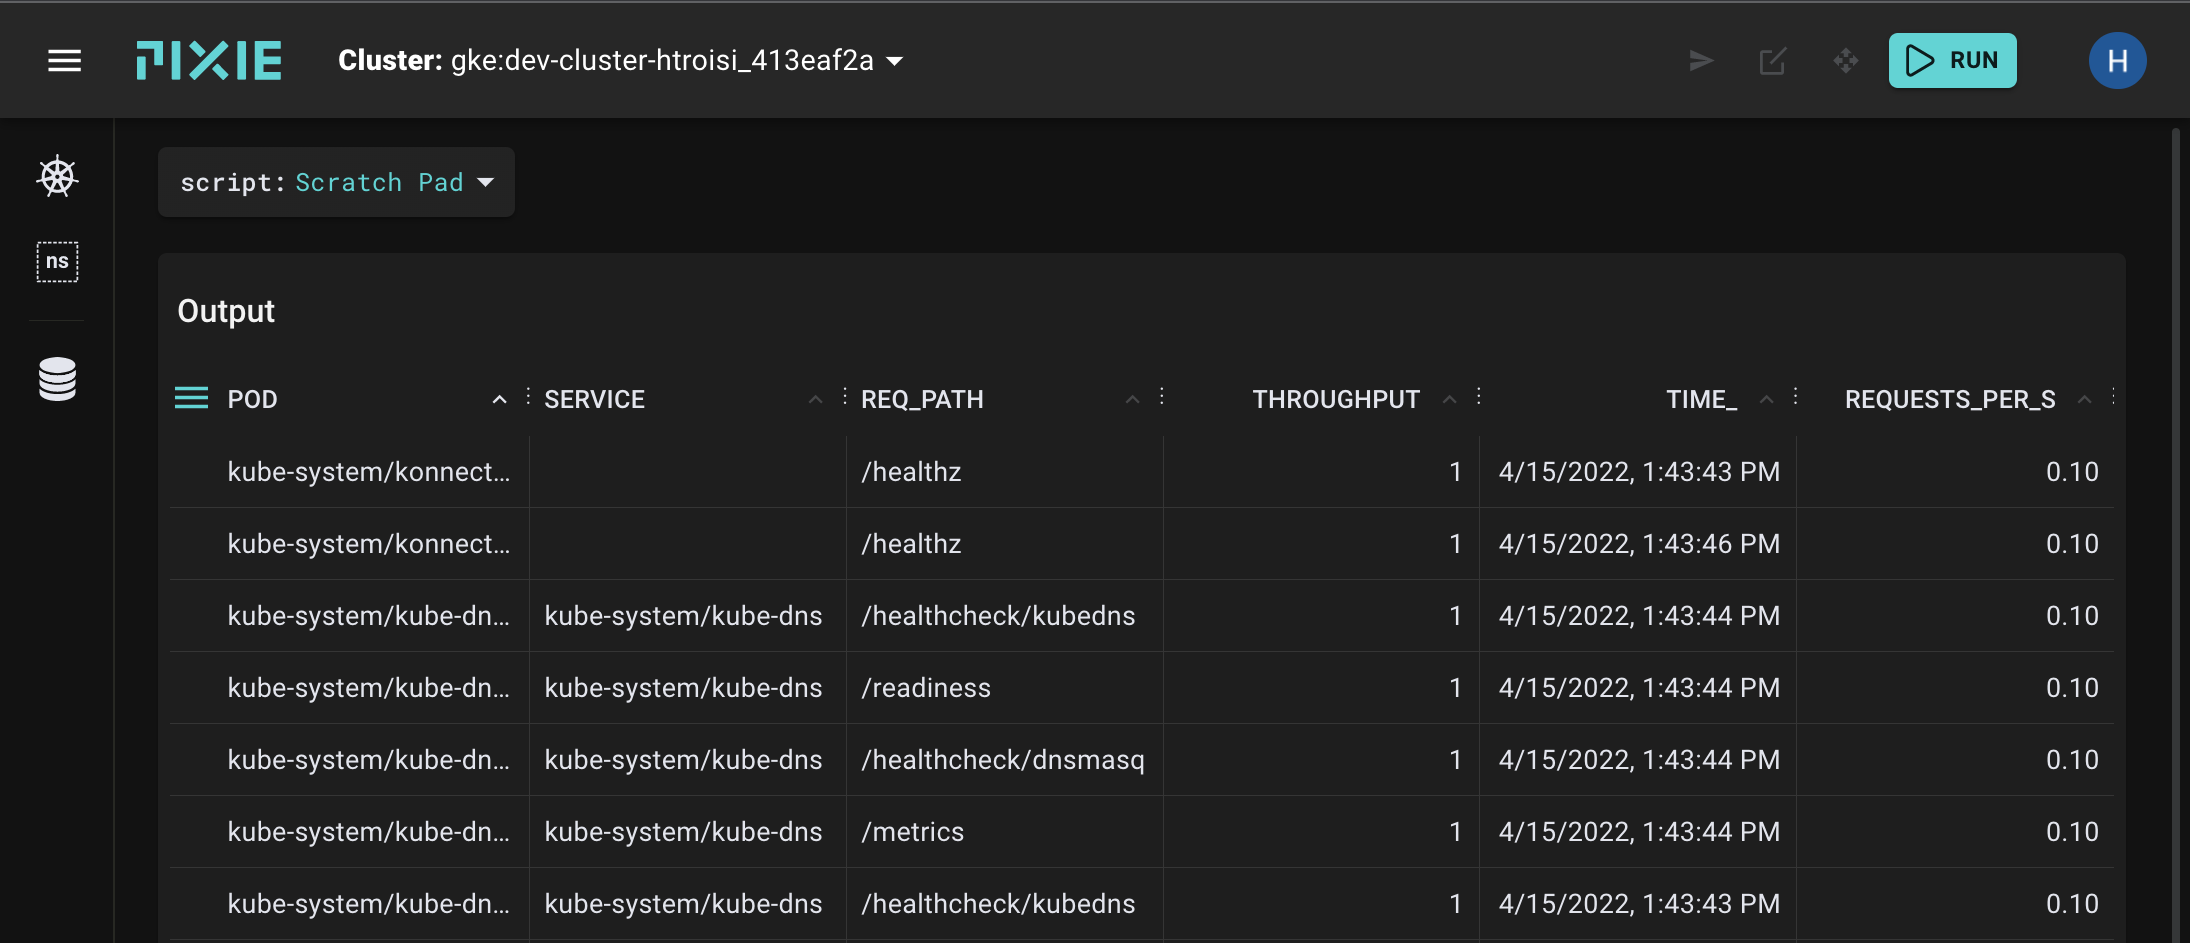
This PxL script calculates the rate of HTTP requests made to each pod in your cluster and exports that data as an OTel Gauge metric.
otel-collector-* pod. If the export was successful, you should see logs similar to:2022-04-15T20:48:20.633Z INFO loggingexporter/logging_exporter.go:54 MetricsExporter {"#metrics": 32}
If this is your first PxL script, you may want to check out the Writing a PxL Script Tutorial to learn more. We'll give a high-level overview of this script below.
The first part of the PxL script (lines 1-19) read in the http_events data and count the number of requests made to each pod from the last 10s.
import px# Read in the http_events tabledf = px.DataFrame(table='http_events', start_time='-10s', end_time=px.now())# Attach the pod and service metadatadf.pod = df.ctx['pod']df.service = df.ctx['service']# Count the number of requests per pod and servicedf = df.groupby(['pod', 'service', 'req_path']).agg(throughput=('latency', px.count),time_=('time_', px.max),)# Calculate the rate for the time windowdf.requests_per_s = df.throughput / 10
To export the data, you’ll call px.export with the DataFrame as the first argument and the export target px.otel.Data as the second argument.
px.export(df, px.otel.Data(...))
The export target (px.otel.Data) describes which columns to use for the corresponding OpenTelemetry fields. You specify a column using the same syntax as in a regular query: df.column_name or df[‘column_name’]. The columns must reference a column available in the df argument or the PxL compiler will throw an error
The PxL OpenTelemetry exporter needs to talk with a collector. You must specify this information via the endpoint parameter:
endpoint=px.otel.Endpoint(url='otel-collector.default.svc.cluster.local:4317',insecure=True),
The endpoint url must be an OpenTelemetry gRPC endpoint. If the OpenTelemetry gRPC endpoint is not secured with SSL, you can set insecure=True. Don’t specify a protocol prefix. Optionally, you can also specify the headers passed to the endpoint. Some OpenTelemetry collector providers look for authentication tokens or api keys in the connection context. The headers field is where you can add this information.
Note that if you’re writing a plugin script, this information will be passed in by the plugin context and should not be specified. We'll remove this endpoint parameter when we set up the Plugin in Step 3.
The core idea of the PxL OpenTelemetry export is that you’re converting columnar data from a Pixie DataFrame into the fields of whatever OpenTelemetry data that you wish to capture. You can reference a column by using the attribute syntax df.column_name. Under the hood, Pixie will convert the values for each row into a new OpenTelemetry message. The columns must match up with the DataFrame that you are exporting (the first argument to px.export), otherwise you will receive a compiler error.
The resource parameter defines the entity producing the telemetry data. Users define the resource argument as a dictionary mapping attribute keys to the STRING columns that populate the attribute values. The PxL configuration expects service.name to be set, all other attributes are optional.
When creating new attribute keys, keep in mind OpenTelemetry has a recommended pattern that you should follow to maintain broad compatibility with OpenTelemetry collectors.
resource={# service.name is required by OpenTelemetry.'service.name' : df.service,'service.instance.id': df.pod,'k8s.pod.name': df.pod,},
The data parameter allows you to specify a list of metrics or traces that are generated from the DataFrame. In the example script, we specify a single Gauge metric for the df.request_per_s column. We also supply an attribute for the metric, req_path. Each Metric and Trace type supports a custom attribute field. Metric/Trace attributes work similarly to Resource attributes, but they are scoped only to the specific method
data=[px.otel.metric.Gauge(name='http.throughput',description='The number of messages sent per second',value=df.requests_per_s,attributes={'req_path': df.req_path,})]
We currently support a limited set of OpenTelemetry signal types: metric.Gauge, metric.Summary and trace.Span. We also support a subset of the available fields for each instrument. You can see the full set of features in our api documentation. If you want support for other fields, please open an issue.
Now that we have a PxL script that exports OTel data, let's set up the Plugin System to run this script at regularly scheduled intervals.
Navigate to the Plugin tab on the Admin page (/admin/plugins).
Click the toggle to enable the OpenTelemetry plugin.
Expand the plugin row (with the arrow next to the toggle) and enter the export path.
If you are using the demo collector from Step 1, then you'll use the same export path pictured below:
otel-collector.default.svc.cluster.local:4317
SAVE button. The demo OTel collector does not support TLS.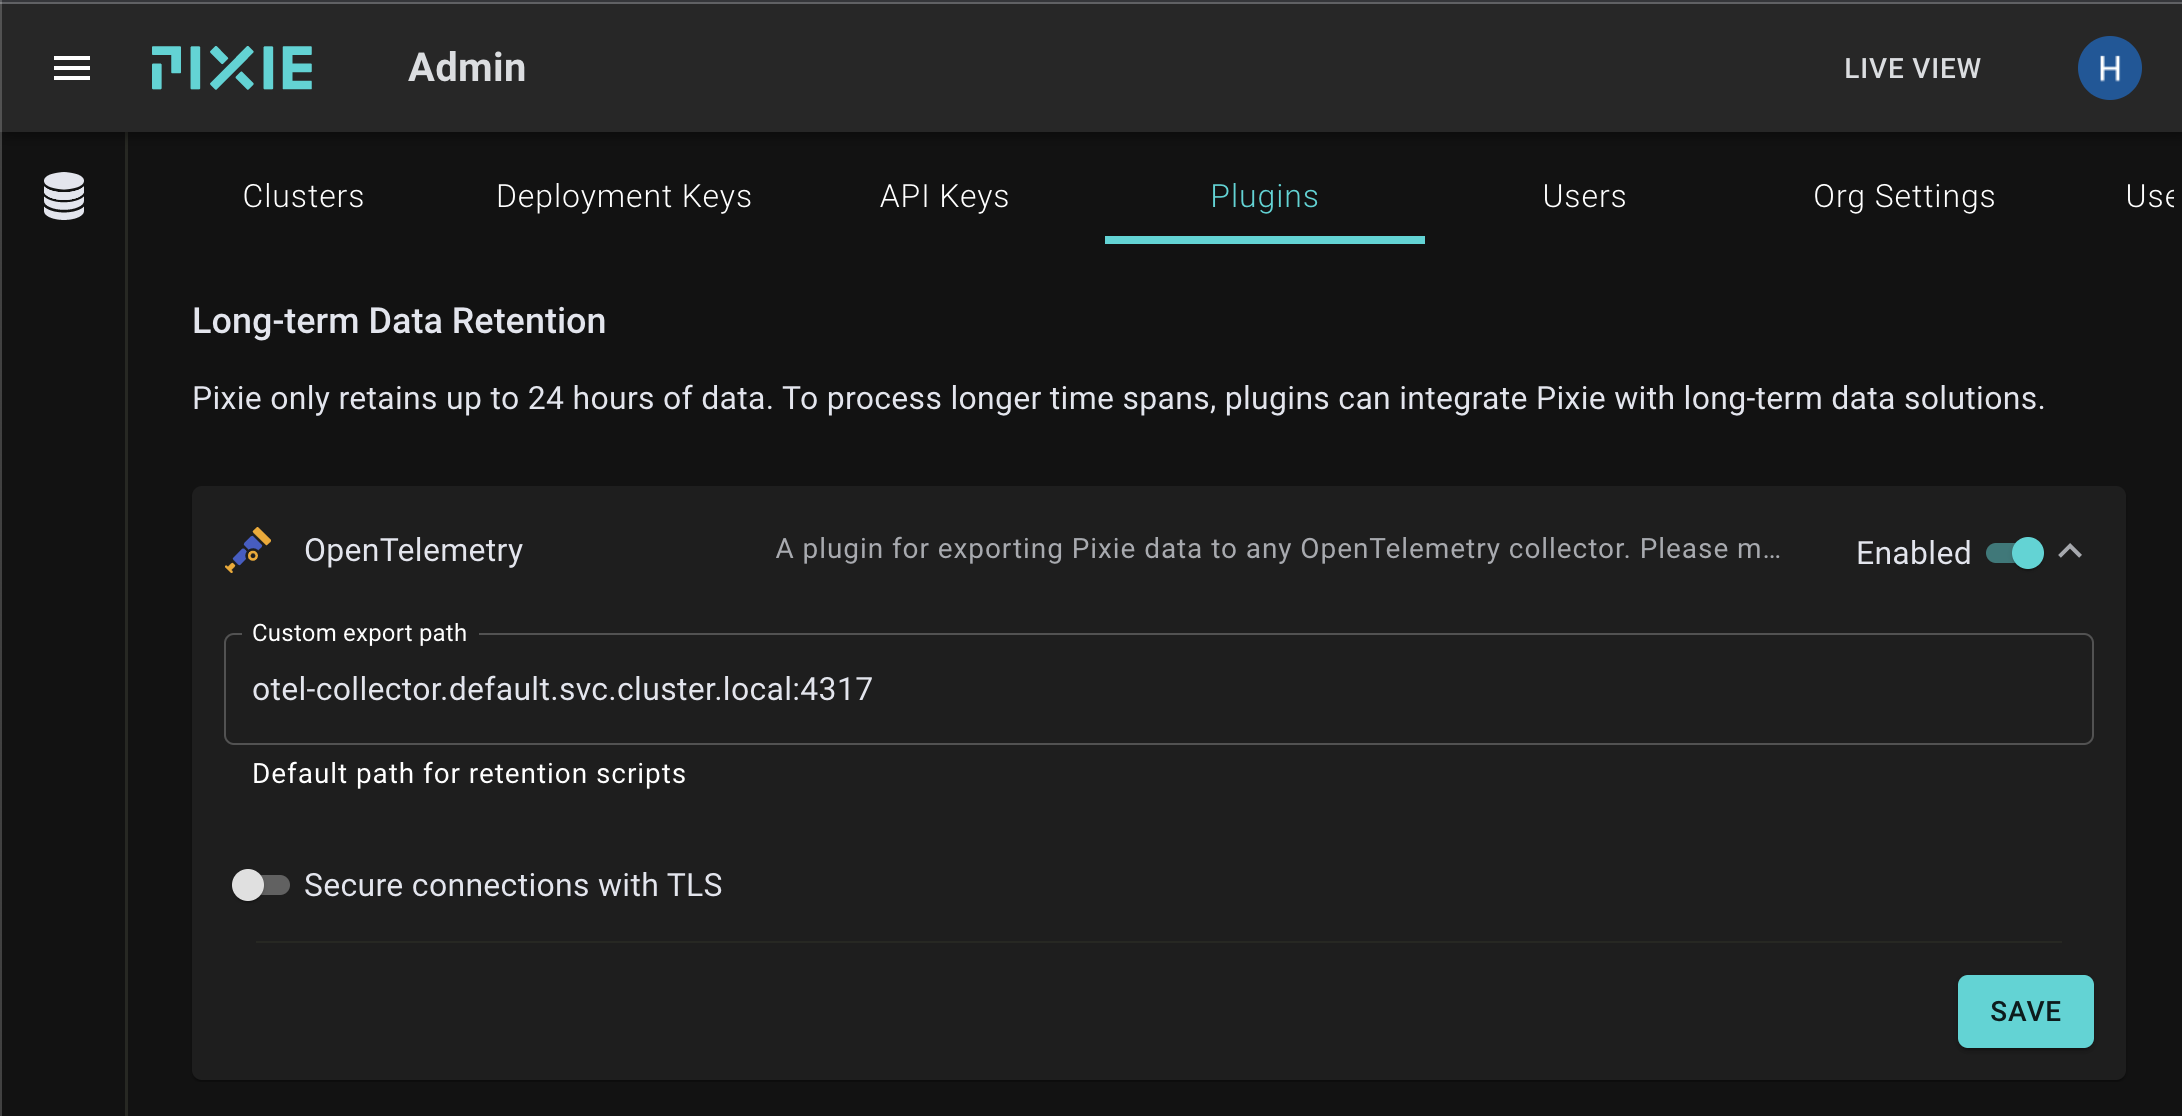
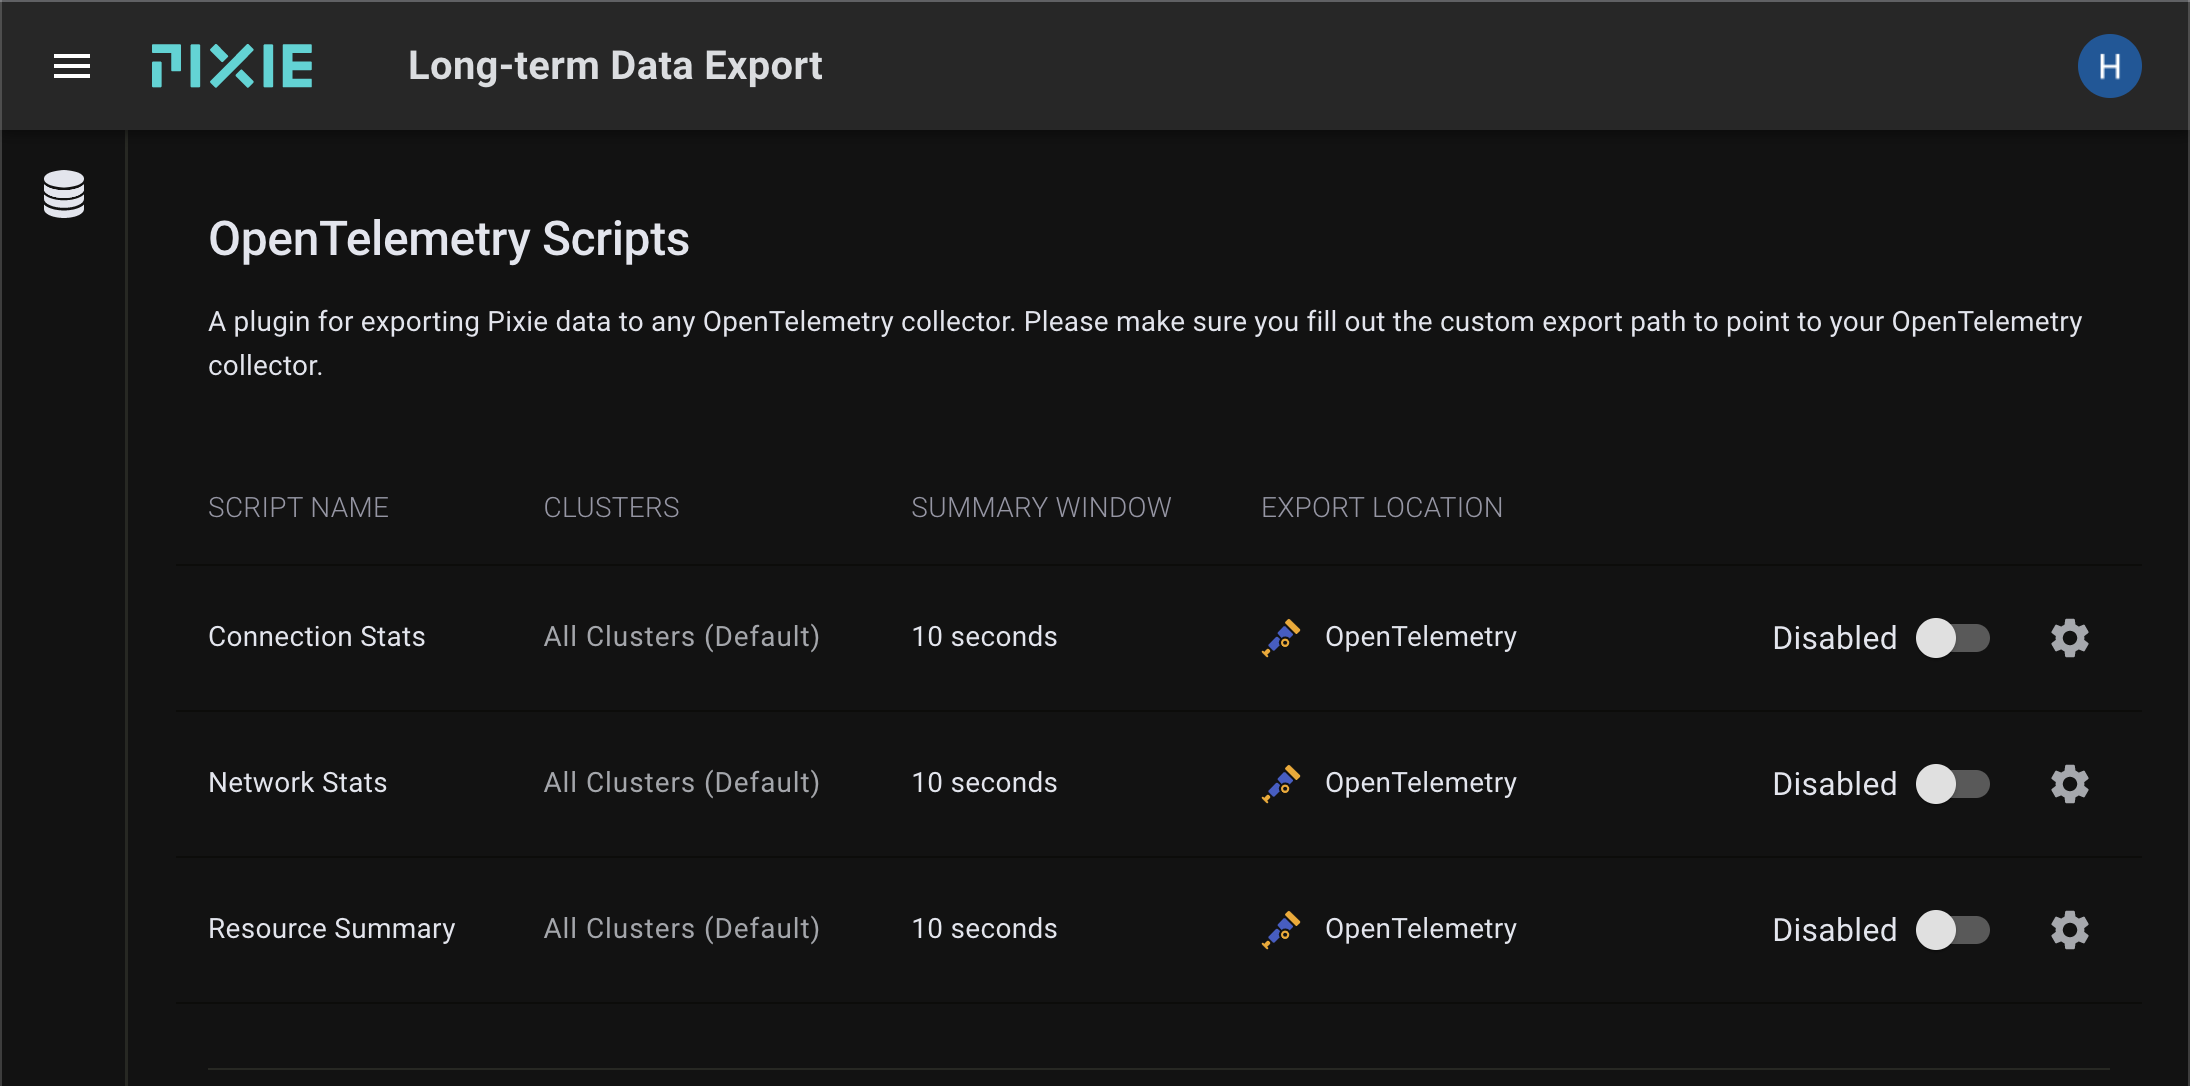
Select the + CREATE SCRIPT button.
Enter HTTP Throughput in the Script Name field.
Replace the contents of the PxL field with the following:
import px# Read in the http_events tabledf = px.DataFrame(table='http_events', start_time=px.plugin.start_time, end_time=px.plugin.end_time)# Attach the pod and service metadatadf.pod = df.ctx['pod']df.service = df.ctx['service']# Count the number of requests per pod and servicedf = df.groupby(['pod', 'service', 'req_path']).agg(throughput=('latency', px.count),time_=('time_', px.max),)# Change the denominator if you change summary window size away from 10s.df.requests_per_s = df.throughput / 10px.export(df, px.otel.Data(resource={# service.name is required by OpenTelemetry.'service.name' : df.service,'service.instance.id': df.pod,'k8s.pod.name': df.pod,},data=[px.otel.metric.Gauge(name='http.throughput',description='The number of messages sent per second',value=df.requests_per_s,attributes={'req_path': df.req_path,})]))
This is the script we developed in Step 2 with a few modifications:
- We changed the DataFrame's
start_timeandend_timearguments to usepx.plugin.start_timeandpx.plugin.end_time. These are set whenever the plugin executes the script. The size of this window sample can be configured using theSummary Windowfield on this page.
- We removed the
Endpointparameter. The plugin sets this value from what We configured in Step 3.
- We removed the
px.display()call on the last line. This was used to display the data in the Live UI when developing our script in the Scratch Pad.
Select the OpenTelemetry option from the Plugin field drop-down menu.
Click the SAVE button.
To validate that the data is being received by the OTel collector, check logs for the the otel-collector-* pod. If the plugin configuration was successful, you should see logs every 10 seconds:
2022-04-15T21:17:27.530Z INFO loggingexporter/logging_exporter.go:54 MetricsExporter {"#metrics": 32}2022-04-15T21:17:37.570Z INFO loggingexporter/logging_exporter.go:54 MetricsExporter {"#metrics": 30}2022-04-15T21:17:47.609Z INFO loggingexporter/logging_exporter.go:54 MetricsExporter {"#metrics": 29}2022-04-15T21:17:57.449Z INFO loggingexporter/logging_exporter.go:54 MetricsExporter {"#metrics": 29}
Congrats! You're now exporting Pixie data to an OTel collector.
Having problems? Check out the Pixie Plugin Troubleshooting guide.
